GPERC(VarNum,GroupOffset/StartDate,Grouping/EndDate, Percentile, Method)
VarNum: The variable number to get the percentile for.
GroupOffset/StartDate: Used with the Grouping parameter to set the dates to calculate the stat for. Sets the number of Groups (set by the Grouping Parameter) to be added to set the dates. See examples below. If this field is a date string (i.e. "07/16/2004") or refers to a cell with a date in it, it is assumed to be the start date to calculate the stat for.
Grouping/EndDate: Used to set which dates to calculate the stat for. If the Grouping is a date literal string (i.e. "07/16/2004") or refers to a cell with a date in it, it is assumed to be the end date to calculate the stat for. Common Groupings are:
"D" Days
“M” Monthly
"R" Report Dates
Click here for available Grouping options
Percentile: The percentile that should be looked up (0-100).
Method: The method to use when a percentile falls between 2 known percentiles. Enter a 1, 2, 3 or 4 depending on the method you wish to use (see below.) All methods multiply the number of available samples by the percentile desired and divides by 100. (i.e., 31 samples * 90 Percentile/100 total percentile = 27.90) to calculate the "slot" to retrieve the value from. The difference in the methods is how they use that number:
Method 1 (round up): Order the values from lowest to highest, then round the slot number UP to the nearest available slot and return the number contained within that slot. (Slot 28 in the example above) The slot number is always rounded up; this is in compliance with the corresponding EPA standards (http://www.doh.wa.gov/ehp/dw/ccr_material/ccrfaq.htm):
The following instructions (taken from Chapter 246-290-025 WAC, 40 CFR Section 141.80) are written using lead as the example, but they apply in the same way to copper results.
1. Put all of your lead results in increasing order, starting with the smallest value and ending with the largest value, including non-detects. You'll probably have several non-detects listed first, followed by a few detections. Make sure your detections are in increasing order.
2. Multiply the number of samples you took by 0.9. Round this result up to the next highest whole number.
3. Go to your ordered list of lead sample results and identify the sample that corresponds to the whole number from step 2 above.
4. The concentration of that sample is the 90th percentile.
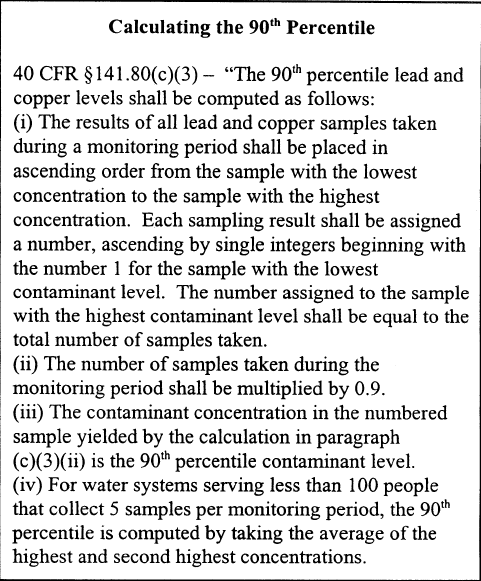
Method 2 (average 2 numbers): Order the values from lowest to highest and average the two numbers in the slots on either side of the slot calculated. (Slots 27 and 28 would be averaged in the example above) This method was implemented for special cases as stated in 40 CFR Section 141.80(c)(3)(iv) where "the 90th percentile is computed by taking the average of the highest and second highest concentrations" (see exerpt below).
Method 3 (Scientic Rounding): Order the values from lowest to highest, then round the slot number using using Scientific Rounding and return the number contained within that slot.
Method 4 (Interpolate): Order the values from lowest to highest and interpolate the two numbers in the slots on either side of the slot calculated. (Slots 27 and 28 would be used and the number would be interpolated as .9 between the two numbers). NOTE: This is the technique the Excel Percentile function uses.
Method 5 (Interpolate, exclude first and last values): Order the values from lowest to highest,remove the first and last value, and interpolate the two numbers in the slots on either side of the slot calculated. NOTE: This is the technique the Excel Percentile.EXC function uses.
Method 6 (Interpolate): Order the values from lowest to highest and interpolate the two numbers in the slots on either side of the slot calculated. (Slots 27 and 28 would be used and the number would be interpolated as .9 between the two numbers). NOTE: Specified by Connecticut DPH and is slightly different Interpolation with Method 4. Example to calc the 90th percentile of 7 samples:
7 * 90/100 = 6.3
Find the difference between the 6th (1.73) and 7th (1.95) ranked values:
1.95 - 1.73 = 0.22
Multiple .3 (the fractional part of the 6.3 above) times the difference:
0.3 * .22 = 0.066
Add 0.066 to the 6th ranked result:
1.73 + 0.066 = 1.796
In all methods, if an exact slot number is calculated, the number in the corresponding slot is returned. Example, the 90th Percentile of 10 results in the value in the 9th slot regardless of method.