USING:
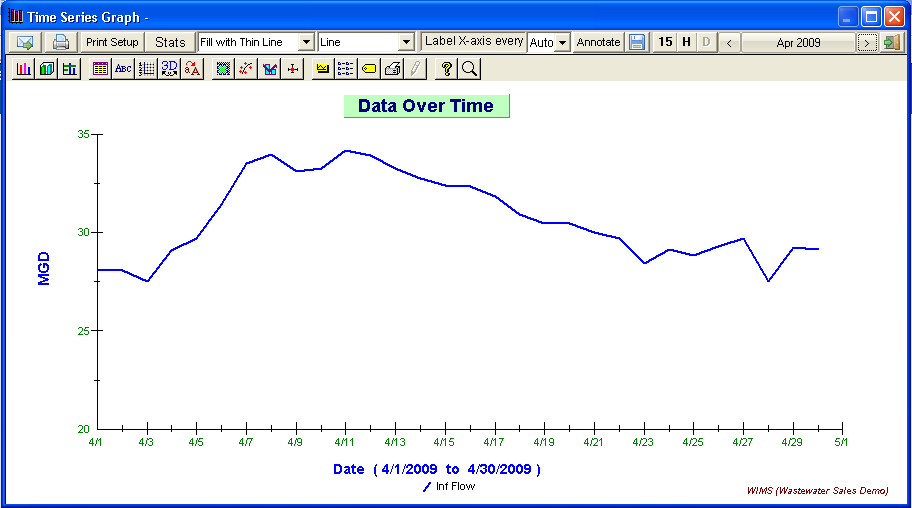
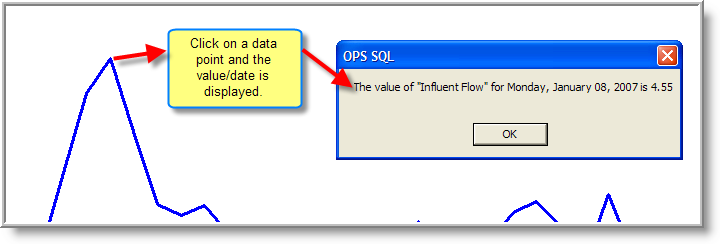
Time Series graphs are "Hot". This means you can click on a data point to display the actual data values for that point.
The graph properties toolbar (the 2nd row of buttons at the top of the graph view window) buttons open a specific page of the Graph Properties Pages which can be used to modify the appearance of the graph. Click here for more information on customizing the appearance of graphs.
BUTTONS:
 |
Outputs graph as a jpg and emails it to user specified email addresses. |
 |
Outputs graph to the current printer. See Notes below for tips on printing. |
 |
Allows selection and setup of the printer. |
 |
Displays the Time Series Statistics form. Used to view or print statistical information about each data set and select which statistics to display for each variable on the graph. Min, Max, QC, Mean, permit limits and other statistics can be displayed. |
 |
Group/show data by 15 minute intervals. |
 |
Group/show data by hourly intervals. |
 |
Group/show data by daily intervals. |
 |
Saves the currently displayed graph. All of the setup parameters and graph properties are saved. The next time the graph is loaded (by Load button on Time Series Input form), the selected data sets are refreshed from the database. A saved graph can also be used with Multi Graph Output.
|
 |
Exit the graph view window and returns to Time Series Input. |
FIELDS:
Fill Style: Specifies how the graph handles displaying non-consecutive data points (when data does not exist for every day). This setting is applicable only to the Line type graphs (with or without symbols). The default setting is Fill with thin line. In this case, a thin line will be drawn from the last data point to the next when there are days in between with no data. Other fill styles include Same Style which uses the same line type as the rest of the graph, Dashed Line and Thick Line which uses those line types and Show Gaps. Show Gaps leaves openings in the line whenever data is not present every day. This setting works fine in most cases but turning on the data point symbols is recommend and heres why; if you have data points for Mondays, Wednesdays and Fridays and Show Gaps is selected with a graph style of Line the graph will appear blank because none of the data points are on consecutive days. Select Line w/Symbols and symbols will represent your data.
Graph Type/Style: Select the graph style and type from the dropdown list. The list contains the most common selections. Other styles and types are available using settings on the Graph Properties pages. The Fill Styles (see above) only apply to the Line type graphs (with or without symbols).
Label X-Axis Every: This field allows the user to specify how often the x-axis is labeled. The list provides an Auto setting which forces WIMS to decide. The other choices are a number of days. For example, if you have 3 selected, a date label will be displayed every 3 days.
NOTES:
See Graph Print Method [General Setting] if you are having trouble printing graphs as this allows you to change the method graphs are output and depending on your environment one method may work better.
Tip: In order to print your graph on different paper sizes (11 x 17 ledger, legal, etc...):
-
-
Choose the paper size and tray (if required) BEFORE launching (starting) WIMS.
-
View your graph and click print. In Graph Print Method 1, WIMS will print the graph to fill the current paper size of the printer.