|
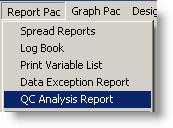
Outputs a report that provides Quality Control data for a variable or a set of variables. Report data includes summary statistics including Average, Min, Max, etc.. and flags QC abnormalities (i.e. "out of control" values) such as values above the Upper Control Limit. |
|
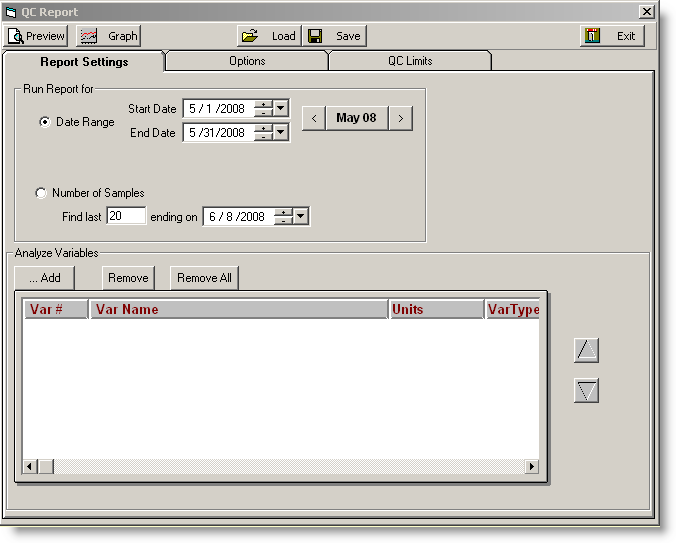
BUTTONS:
 |
Sends the QC Analysis Report to the Print Preview window based on the current selections. |
 |
Displays the data in a Sample Graph. |
 |
Loads a saved Sample Graph Definition. |
 |
Saves the current settings to a Sample Graph Definition file that can be loaded at a latter time. Saves the settings (i.e. variables, QC Flagging options, outlier detection options...) and the graph settings (i.e. color changes, background) that you may have changed. |
 |
Closes the form. |
 |
Used to set a date range |
 |
Brings up the Variable Browser window in order to add variables to be analyzed. |
 |
Removes the selected variable(s) (rows) from the list. |
 |
Removes all variables from the list. |
 |
Moves the currently selected variable up one row in the list. Note that this has no effect on the order the data is analyzed as the dataset is simply sorted by it's datestamp. |
 |
Moves the currently selected variable down one row in the list. Note that this has no effect on the order the data is analyzed as the dataset is simply sorted by it's datestamp. |
Run Report for: Sets how to find the data for analysis. You have two options
Date Range: Enter the Start and End Date of the report. All values in the date range for all selected Variables will be analyzed. See Entering Dates for tips on entering dates.
Number of Samples: Finds the last 20 (or other user specified value) for all selected variables. The report will start the search on the ending on date and search back until it finds the specified number of samples (up to 2000 days).
Analyze Variables: Select all variables to analyze. If more than one variable is selected, data is combined.

The control limits used for the report. When a variable is selected if no limits have been entered the QC Limits for the variable will be retrieved.

The following QC abnormalities are checked. You can set which ones to report using the options tab for the report.
All points above or below the Upper and Lower Control Limit: Checks each report value against the Upper and Lower Control Limit.
??? Consecutive points are above or below the Warning Limits: Default 2. If 2 or more consecutive points are above or below the Warning Limit the data is flagged.
??? Consecutive points are on one side of the mean: Default 7. If 7 or more consecutive points fall on the same side of the QC Mean. QC Mean is the average of the UCL and the UWL. The QC Mean can be adjusted on the Report Settings tab.
??? Consecutive points are sloping in one direction: Default 5. If 5 or more consecutive points are sloping in the same direction (i.e. values of 1,3,4,7,9 are sloping up for 5 points since each point is greater than the previous point).
Outlier Detection: Used to detect and mark outliers (values that are abnormally distant from the rest of the data). Outliers will be marked with a '*' in the report. Outliers will also be removed from the data set and the Mean, Standard Deviation, and mean +-2 and 3 standard deviations are recalculated and reported separately from the basic statistics. Detecting outliers to calculate future QC limits is recommended as standard deviations from data sets that include outliers may be misleading. You have the following outlier detection options:
Off: Outliers will not be detected
T Test (Critical Value 5%): Tests each value using the Critical Value 5% table. Calculates a "Z" value for the high value in the set of data and compares it to the Critical Z value for the number of results (N in the table) from the table below. Z = (Mean - data value) / Standard Deviation. If the Z is above the Critical Z it is marked as an outlier and the test is repeated until no outliers exist.
| N |
Critical Z |
N |
Critical Z |
| 3 |
1.15 |
22 |
2.924 |
| 4 |
1.49 |
23 |
2.946 |
| 5 |
1.75 |
24 |
2.968 |
| 6 |
1.94 |
25 |
2.99 |
| 7 |
2.1 |
26 |
3.012 |
| 8 |
2.22 |
27 |
3.034 |
| 9 |
2.32 |
28 |
3.056 |
| 10 |
2.41 |
29 |
3.078 |
| 11 |
2.48 |
30 |
3.1 |
| 12 |
2.55 |
31-39 |
3.1+(((n-30)/10)*(3.24-3.1)) |
| 13 |
2.61 |
40 |
3.24 |
| 14 |
2.66 |
41-49 |
3.24+(((n-40)/10)*(3.34-3.24)) |
| 15 |
2.71 |
50 |
3.34 |
| 16 |
2.75 |
51-59 |
3.34+(((n-50)/10)*(3.41-3.34)) |
| 17 |
2.79 |
60 |
3.41 |
| 18 |
2.82 |
61-99 |
3.41+(((n-60)/10)*(3.6-3.41)) |
| 19 |
2.85 |
100 |
3.6 |
| 20 |
2.88 |
101-119 |
3.6+(((n-100)/10)*(3.66-3.6)) |
| 21 |
2.902 |
120 |
3.66 |
|
|
>120 |
3.7 |
T Test (Critical Value 1%): Tests each value using the Critical Value 1% table. Calculates a "Z" value for the high value in the set of data and compares it to the Critical Z value for the number of results (N in the table) from the table below. Z = (Mean - data value) / Standard Deviation. If the Z is above the Critical Z it is marked as an outlier and the test is repeated until no outliers exist.
| N |
Critical Z |
N |
Critical Z |
| 3 |
1.15 |
22 |
2.596 |
| 4 |
1.46 |
23 |
2.614 |
| 5 |
1.67 |
24 |
2.632 |
| 6 |
1.82 |
25 |
2.65 |
| 7 |
1.94 |
26 |
2.668 |
| 8 |
2.03 |
27 |
2.686 |
| 9 |
2.11 |
28 |
2.704 |
| 10 |
2.18 |
29 |
2.722 |
| 11 |
2.24 |
30 |
2.74 |
| 12 |
2.29 |
31-39 |
2.74 + (((n - 30) / 10) * (2.87 - 2.74)) |
| 13 |
2.33 |
40 |
2.87 |
| 14 |
2.37 |
41-49 |
2.87 + (((n - 40) / 10) * (2.96 - 2.87)) |
| 15 |
2.41 |
50 |
2.96 |
| 16 |
2.44 |
51-59 |
2.96 + (((n - 50) / 10) * (3.03 - 2.96)) |
| 17 |
2.47 |
60 |
3.03 |
| 18 |
2.5 |
61-99 |
3.03 + (((n - 60) / 10) * (3.21 - 3.03)) |
| 19 |
2.53 |
100 |
3.21 |
| 20 |
2.56 |
101-119 |
3.21 + (((n - 100) / 10) * (3.27 - 3.21)) |
| 21 |
2.578 |
120 |
3.27 |
|
|
>120 |
3.3 |
Grubbs Test: Tests each value against the "Grubbs" test for outliers. The Grubbs test calculates a "Z" value for the high value in the set of data and compares it to the Critical Z value from the table below. Z = (Mean - data value) / Standard Deviation. If the Z is above the Critical Z it is marked as an outlier and the Grubbs test is run again.
| N |
Critical Z |
N |
Critical Z |
N |
Critical Z |
| 3 |
1.15 |
20 |
2.71 |
37 |
3.00 |
| 4 |
1.48 |
21 |
2.73 |
38 |
3.01 |
| 5 |
1.71 |
22 |
2.76 |
39 |
3.03 |
| 6 |
1.89 |
23 |
2.78 |
40 |
3.04 |
| 7 |
2.02 |
24 |
2.80 |
50 |
3.13 |
| 8 |
2.13 |
25 |
2.82 |
60 |
3.20 |
| 9 |
2.21 |
26 |
2.84 |
70 |
3.26 |
| 10 |
2.29 |
27 |
2.86 |
80 |
3.31 |
| 11 |
2.34 |
28 |
2.88 |
90 |
3.35 |
| 12 |
2.41 |
29 |
2.89 |
100 |
3.38 |
| 13 |
2.46 |
30 |
2.91 |
110 |
3.42 |
| 14 |
2.51 |
31 |
2.92 |
120 |
3.44 |
| 15 |
2.55 |
32 |
2.94 |
130 |
3.47 |
| 16 |
2.59 |
33 |
2.95 |
140 |
3.49 |
| 17 |
2.62 |
34 |
2.97 |
>140 |
3.5 |
| 18 |
2.65 |
35 |
2.98 |
|
|
| 19 |
2.68 |
36 |
2.99 |
|
|
|
|
|
|
|
|
|
|
|
|
|
|
* Critical Z is interpolated (straight line) if N is not an exact match in the table above.
Manually mark the outliers: Displays the Manually Mark Outliers form that allows you to simply Mark the outliers by hand.
Outlier Type: You can set the outlier detection to detect high, low or all outliers.