Home : Quick Graph
Q14068 - INFO: Quick Graph

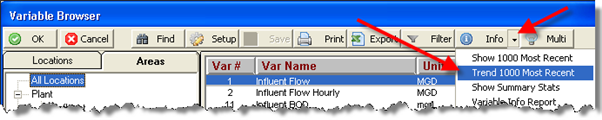
A quick trend graph allows you to view a simple trend of a single variable. 

A quick trend graph can be displayed by:


Using a Quick Trend

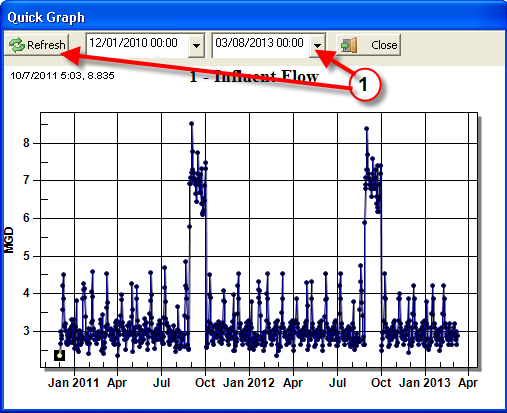
1. Change the graph dates:
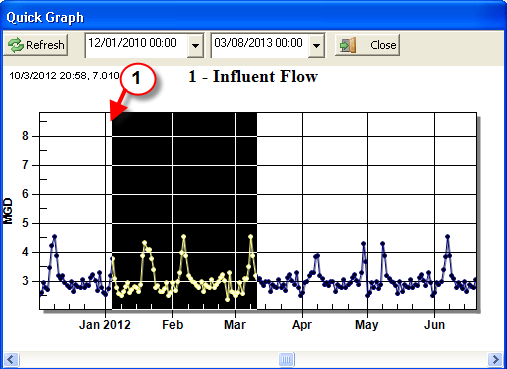
  • Use the date pull downs to set Start and End Date
  • Click Refresh


2. Zoom in on Data

  • Click and drag on graph to zoom in on that area. 
  • Right Click, and choose Undo Zoom to zoom back out.


Related Articles
No Related Articles Available.

Article Attachments
No Attachments Available.

Related External Links
No Related Links Available.
Help us improve this article...
What did you think of this article?

poor 
1
2
3
4
5
6
7
8
9
10

 excellent
Tell us why you rated the content this way. (optional)
 
Approved Comments...
No user comments available for this article.
Created on 3/15/2013 12:56 PM.
Last Modified on 3/15/2013 4:57 PM.
Last Modified by Scott Dorner.
Article has been viewed 5248 times.
Rated 6 out of 10 based on 4 votes.
Print Article
Email Article