Supported variable configurations for the Hach WIMS Direct Server-Side Interface to Narrow Format OLEDB Source.
To configure a variable to get values from a Narrow Format OLEDB source, select Edit/View Variables in the client and select the Interface tab.
Then click Interface To radio button. The drop down box next to the option is now enabled, click the drop down arrow and choose the Narrow Format OLEDB interface name (name given when configuring the interface).
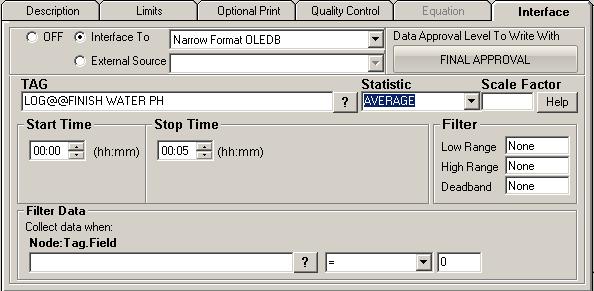
Now you are ready to configure a tag from the Narrow Format OLEDB. The Tag name and a statistic are all that are mandatory.
- TAG: The identifier for the records to summarize for this variable. Format is Tablename@@Tag. The following example LOG@@Finish Water PH will query the Log table for the tag Finish Water PH. Note, each table needs to be configured
Clicking on the question mark will bring up the following screen:
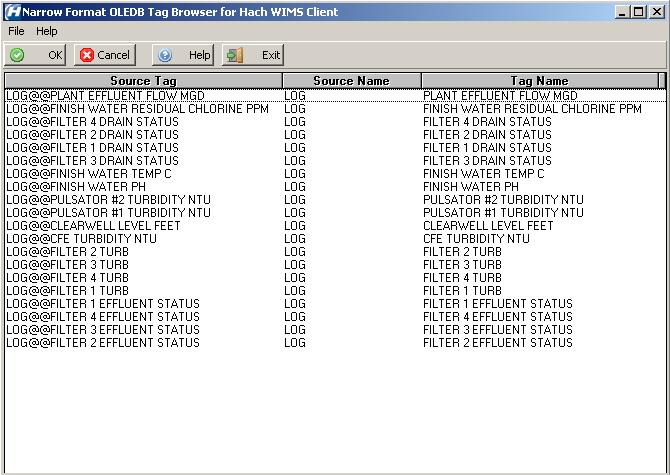
The above screen contains a list of all the available tags that the interface can gather data from. To pick a tag, double click on it and it will then take you back to the Edit Variable screen. If the above screen is blank then you need to make sure that you generated an OPSDATAXML definition file from the Source Configuration screen in the Interface.

 This is a listing of all the statistics supported by this interface. This includes the following statistics for a specified time period:
| AVERAGE |
Take the average of the data points in the time period |
select Avg(value) from Hist.data_values_12_2020 where osi_key = '03005001' and time >='2020-12-01 01:00:00' and time < '2020-12-02 01:00:00' AND data_type = 4 |
| TOTAL |
Take the sum total of all values in the specified time period |
Select Sum(value) from Hist.data_values_12_2020 where osi_key = '03005001' and time >='2020-12-01 01:00:00 and time < '2020-12-02 01:00:00 AND data_type=5 |
| MINIMUM |
Take the minimum value in the specified time period |
select Min(value) from Hist.data_values_12_2020 where osi_key = '03005001' and time >='2020-12-01 01:00:00' and time < '2020-12-02 01:00:00' AND data_type = 2 |
| MAXIMUM |
Take the maximum value in the specified time period. |
select Max(value) from Hist.data_values_12_2020 where osi_key = '03005001' and time >='2020-12-01 01:00:00' and time < '2020-12-02 01:00:00' AND data_type = 3 |
| FIRST |
Take the first reading in the time period |
select value, time from Hist.data_values_12_2020 where osi_key = '03005001' and time >='2020-12-01 01:00:00' and time < '2020-12-02 01:00:00' AND data_type = 1 order by time asc LIMIT 1 |
| LAST |
Take the last reading in the time period. |
select value, time from Hist.data_values_12_2020 where osi_key = '03005001' and time >='2020-12-01 01:00:00' and time < '2020-12-02 01:00:00' AND data_type = 1 order by time desc LIMIT 1 |
| DIFF |
This statistic calculates the difference between the first value and the last value for the period requested (i.e., if the variable is set as a daily variable, DIFF will get the first and last values for each day and subtract them). |
See queries for FIRST and LAST |
| DIFFMAXMIN |
This statistic calculates the difference between the Maximum and Minimum values for the period requested. |
See queries for MAXIMUM and MINIMUM |
 This is the value to multiply the result by when using parameter variable types. Commonly used to convert from one unit base to another. For example to convert gallons per minute (GPM) to gallons per day (GPD), set the scale factor to 1440 (1440 minutes per day).
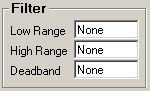 All three fields must have numeric values or the word None (as shown). The Low Range and High Range will crop data from the source. For example to eliminate negative numbers from a particular tag, set the Low Range to 0 (zero) - this will get any values equal to or greater than 0 (zero). The Deadband is used for the statistic Inventory and will elliminate noise levels up to the value specified. For example, if you enter .5 next to Deadband, any value change of .5 or less, will be ignored.
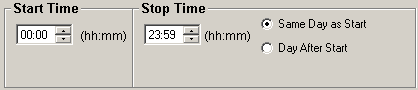
- Start Time will set the beginning of the time slot for this variable.
- Stop Time will set the ending time for the time slot.
- Same Day as Start is only used by daily variables and it means the stop time is on the same day as the start time.
- Day After Start is also only used by daily variables and it means the stop time is a day after the start time.
-
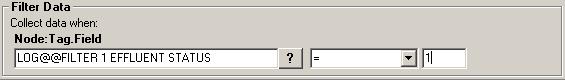
- Node Tag Field is the signal tag to filter by from the Narrow Format OLEDB. You can find tag names using the ? the same way you found the signal tag above.
- The second field is the filter operator drop down. This includes the following:
| SYMBOL |
DESCRIPTION |
| < |
Less than, true if the value returned is less than the filter value |
| > |
Greater than, true if the value returned is greater than the filter value |
| = |
Equal to, true if the value returned is equal to the filter value |
| <= |
Less than or equal to, true if the value returned is less than or equal to the filter value |
| >= |
Greater than or equal to, true if the value returned is greater than or equal to the filter vaue |
| <> |
Not equal, true if the value returned is not equal to the filter value |
- The last field is the filter value. The value returned from the filter tag is compared to this value.