|
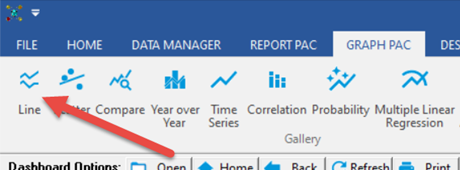
Graphs up to ten (10) variables on separate y-axis and develops a heatmap showing correlations between variables. |
 |
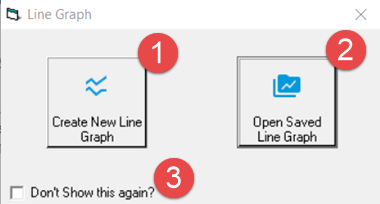
When the Line Graph menu item is selected, you will be presented with a dialog:
1. "Create New Line Graph" will display the Variable Browser allowing you to select up to 10 variables to graph. Select your variables and click OK. Your graph will be displayed.
2. "Open Saved Line Graph" allows selection of a previously saved graph that can be selected and displayed.
3. Check "Don't Show this again?" to skip this step and simply display the Line Graph form in the future. NOTE: See Show Line Graph Startup Form User Setting to re-enable if hidden by mistake.
| 1 |
 |
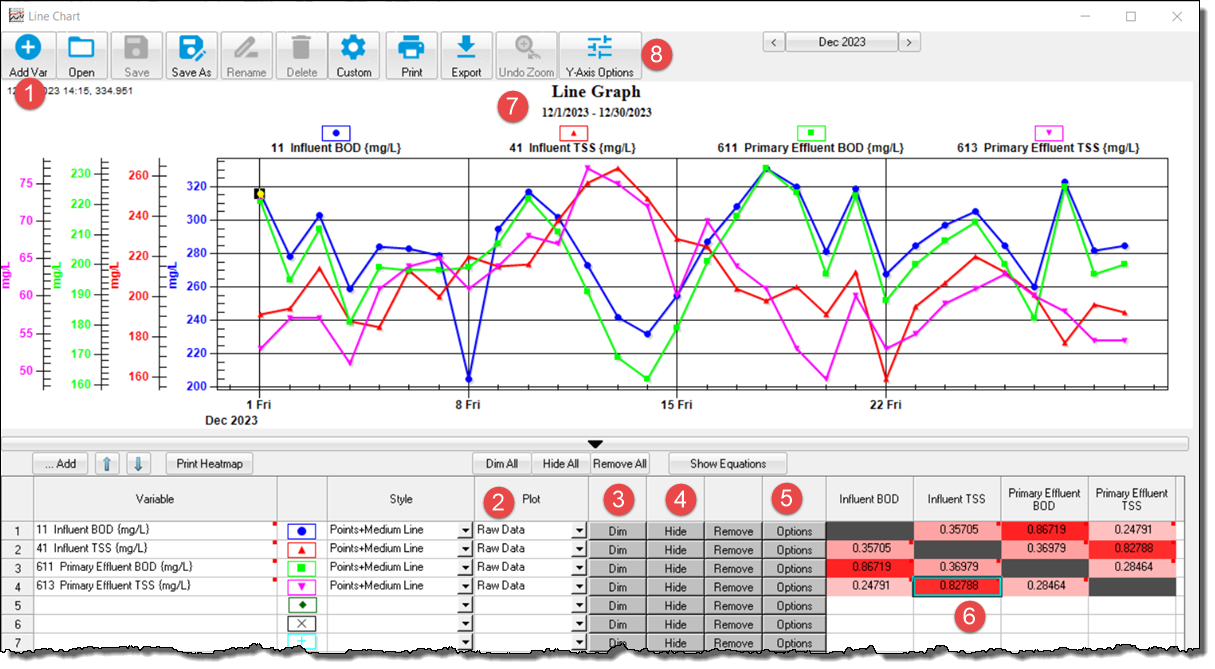
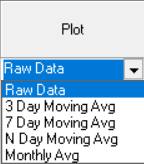
Use Add Var to place variables on the graph. |
| 2 |
 |
|
| 3 |
 |
Use Dim/Brighten to focus on certain variables. |
| 4 |
 |
Use Hide/Unhide toggle to quickly unclutter the graph. |
| 5 |
 |
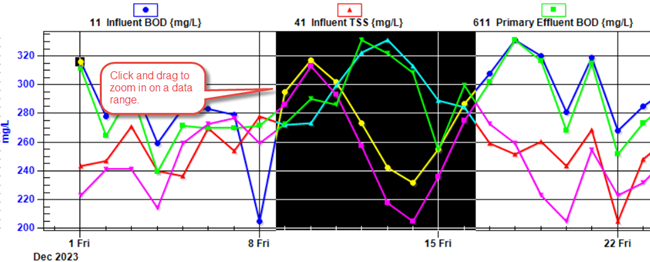
Options allow you display limit lines |
| 6 |
|
Heat map shows the coefficient of correlation (0 to 1). The higher the number, the darker the red, the better the correlation. In this example, Primary Effluent TSS correlates very well to Influent TSS with a coefficient of 0.82788. |
| 7 |
 |
 |
| 8 |
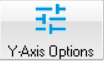 |
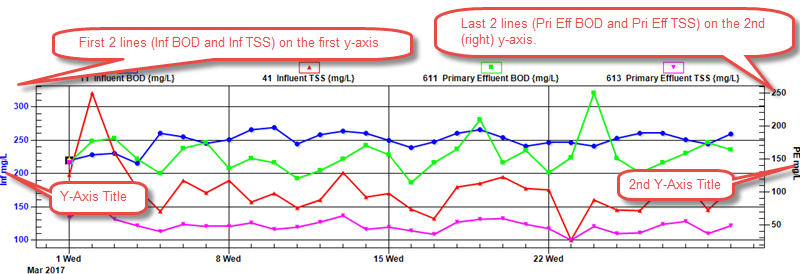
Displays a window used to control how the Y-Axes are displayed:
- Show each line (variable) on separate Y-Axis
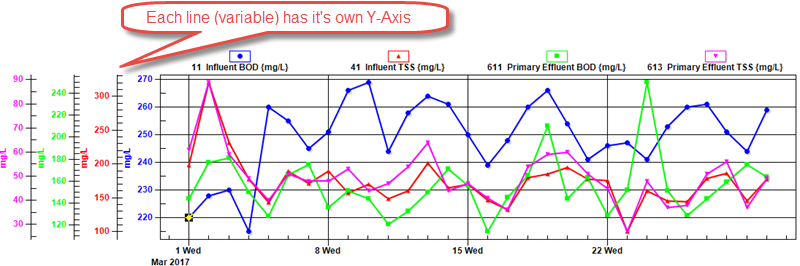
- Show all lines(variables) on one Y-Axis
- Show last x lines (variables) on the 2nd Y-Axis
 |