|
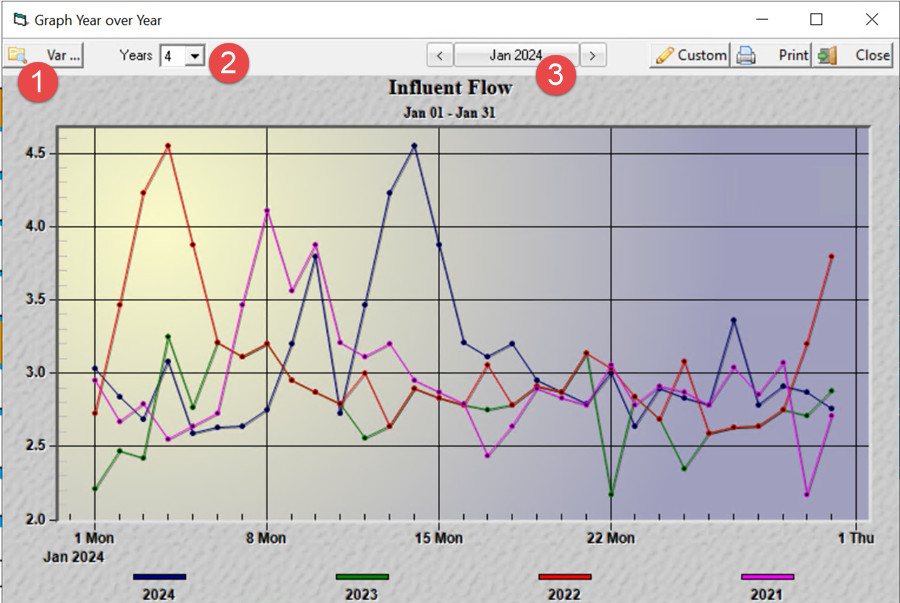
A year over year graph displays a single variable for a date range selected vs the same date range for the previous 1 to 5 years |
 |
To produce a year over year graph showing Influent Flow for January 2024 with January 2023, 2022, and 2021:
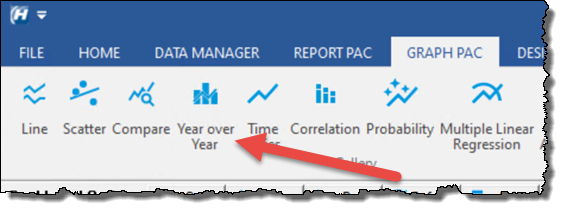
Load Graph Pac, Year over Year.
1. Click Var... and pick Influent Flow
2. Set the number of years to go back from the selected dates.
3. Set the date range for January 2024. NOTE: Dates can be set to any date range within a year (i.e. week, month, quarter, entire year).
There are two other methods to produce a year over year graph:
Method 1: Using Variable Analysis Graphs
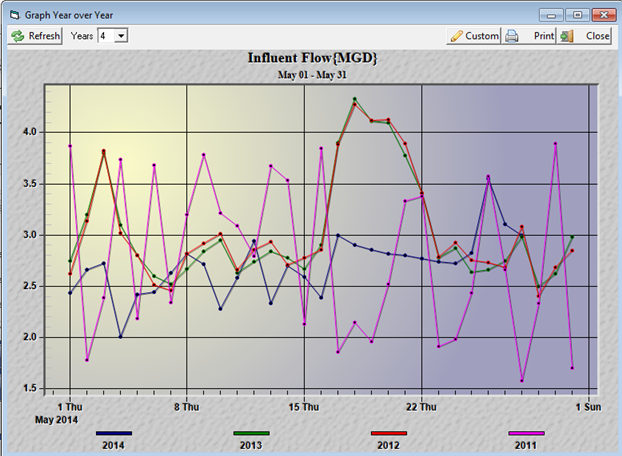
To produce a year over year graph showing Influent Flow for May 2014 with May 2013, 2012, and 2011:
1. Go to Variable Analysis Graphs.
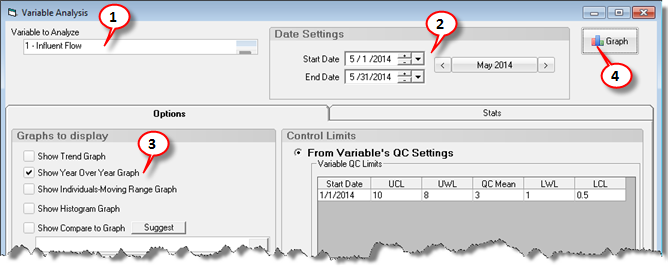
2. Choose your variable and date range. Influent Flow and May 2014:
3. Check the Show Year over Year graph.
4. Click 
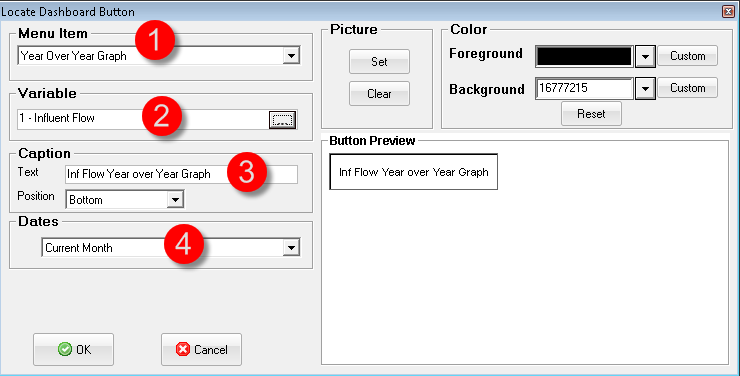
Method 2: Use a dashboard button to display a Year over Year graph for a specific variable.
1. Edit your dashboard using Spread Design.
2. Use Locate, Dashboard button. Choose your variable and Year Over Year Graph. Choose the date range. The Year over Year graph shows the same date range selected vs the previous 1 to 5 years.
3. Save your report/dashboard.
4. Click button on dashboard to display the graph.