Supported variable configurations for the Hach WIMS Server-Side Interface to GE Proficy Historian.
To configure a variable to hold values from GE Proficy Historian, select Edit/View Variables in the client and select the Interface tab.
Then click Interface To radio button. The drop down box next to the option is now enabled, click the drop down arrow and choose the GE Proficy Historian interface name (name given when configuring the interface).

Now you are ready to configure a signal tag from the GE Proficy Historian. The Tag name and a statistic are all that are mandatory.
 This is the tag name in the GE Proficy system. The Proficy Historian referres to it as the Tag Name. The ? symbol (question mark) will allow you to browse the Proficy Historian for tag names. An explanation of the browser can be found in Using Interface Browser Q12429.
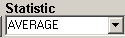 This is a listing of all the statistics supported by this interface. This includes the following statistics for a specified time period:
|
STATISTIC |
DESCRIPTION |
SQL QUERY |
|
AVERAGE |
Take the average of the data points |
SELECT AVG(Value) FROM ihRawData WHERE SamplingMode='Lab' AND Tagname='EF_FLOW' AND Timestamp>='3/1/2009 00:00:00' AND Timestamp <'3/2/2009 00:00:00' AND NumberofSamples=1440 |
|
TOTAL |
Take the sum total of all values |
SELECT SUM(Value) FROM ihRawData WHERE SamplingMode='Lab' AND Tagname='EF_FLOW' AND Timestamp>='3/1/2009 00:00:00' AND Timestamp <'3/2/2009 00:00:00' AND NumberofSamples=1440 |
|
MINIMUM |
Get the minimum value |
SELECT MIN(Value) FROM ihRawData WHERE SamplingMode='Lab' AND Tagname='EF_FLOW' AND Timestamp>='3/1/2009 00:00:00' AND Timestamp <'3/2/2009 00:00:00' AND NumberofSamples=1440 |
|
MAXIMUM |
Get the maximum value |
SELECT MAX(Value) FROM ihRawData WHERE SamplingMode='Lab' AND Tagname='EF_FLOW' AND Timestamp>='3/1/2009 00:00:00' AND Timestamp <'3/2/2009 00:00:00' AND NumberofSamples=1440 |
|
FIRST |
Get the first value |
SELECT TOP 1 Value, Timestamp FROM ihRawData WHERE SamplingMode='Lab' AND Tagname='EF_FLOW' AND Timestamp>='3/1/2009 00:00:00' AND Timestamp <'3/2/2009 00:00:00' AND NumberofSamples=1440 ORDER BY Timestamp |
|
LAST |
Get the last value |
SELECT TOP 1 Value, Timestamp FROM ihRawData WHERE SamplingMode='Lab' AND Tagname='EF_FLOW' AND Timestamp>='3/1/2009 00:00:00' AND Timestamp <'3/2/2009 00:00:00' AND NumberofSamples=1440 ORDER BY Timestamp DESC |
|
DIFF |
Calculate the difference between the first and last values. If the first value is larger than the second then it will perform the following calculation: (10 ^ (Ceil(LOG(first_value) / LOG(10)))) - first_value + last_value
Ceil will cause the value to round up |
- Get FIRST value
- Get LAST value
- RESULT = LAST - FIRST
- IF RESULT < 0 THEN (10 ^ (Ceil(LOG(first_value) / LOG(10)))) - first_value + last_value
|
|
RANGE |
Calculate the absolute value of the difference between the minimum and maximum values |
- Get MIN value
- Get MAX value
- Get ABS(MIN - MAX)
|
|
INVENTORY |
Return the total use based on a tank level signal. For example, the level is 10 feet at midnight and slowly goes down to 2 feet at 2:00 PM, then gets filled to 15 feet and slowly goes down to 8 feet at midnight. The inventory function would return ((10 - 2) + (15 - 8)) = 15. |
- SELECT Value FROM ihRawData WHERE Tagname='TANK_LEVEL' AND SamplingMode='RawByTime' AND Timestamp>='03/01/2009 00:00:00' AND Timestamp<'03/02/2009 00:00:00'
- Loop throught the records returned and sum the downward trends greater than the Deadband
|
|
TIMEGT(x) |
Counts the number of values greater than the given number (x). If left unspecified it will use zero (0). |
SELECT COUNT(Value) FROM ihRawData WHERE SamplingMode='Lab' AND Tagname='EF_FLOW' AND Timestamp>='3/1/2009 00:00:00' AND Timestamp <'3/2/2009 00:00:00' AND NumberofSamples=1440 AND Value > x |
|
TIMELT(x) |
Counts the number of values less than the given number (x). If left unspecified it will use zero (0). |
SELECT COUNT(Value) FROM ihRawData WHERE SamplingMode='Lab' AND Tagname='EF_FLOW' AND Timestamp>='3/1/2009 00:00:00' AND Timestamp <'3/2/2009 00:00:00' AND NumberofSamples=1440 AND Value < x |
|
TIMEEQ(x) |
Counts the number of values equal to the given number (x). If left unspecified it will use zero (0). |
SELECT COUNT(Value) FROM ihRawData WHERE SamplingMode='Lab' AND Tagname='EF_FLOW' AND Timestamp>='3/1/2009 00:00:00' AND Timestamp <'3/2/2009 00:00:00' AND NumberofSamples=1440 AND Value = x |
|
COUNT |
Counts the number of data points. |
SELECT COUNT(Value) FROM ihRawData WHERE SamplingMode='Lab' AND Tagname='EF_FLOW' AND Timestamp>='3/1/2009 00:00:00' AND Timestamp <'3/2/2009 00:00:00' AND NumberofSamples=1440 |
For advanced options, see Advanced Settings for Supported Variable Configuration for Interface Q12447.
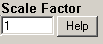 This is the value to multiply the result by when using parameter variable types. Commonly used to convert from one unit base to another. For example to convert gallons per minute (GPM) to gallons per day (GPD), set the scale factor to 1440 (1440 minutes per day).
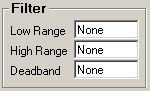 All three fields must have numeric values or the word None (as shown). The Low Range and High Range will crop data from the source. For example to eliminate negative numbers from a particular tag, set the Low Range to 0 (zero) - this will get any values equal to or greater than 0 (zero). The Deadband is used for the statistic Inventory and will elliminate noise levels up to the value specified. For example, if you enter .5 next to Deadband, any value change of .5 or less, will be ignored.
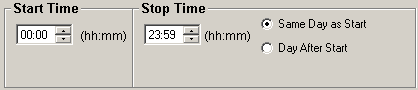
- Start Time will set the beginning of the time slot for this variable.
- Stop Time will set the ending time for the time slot.
- Same Day as Start is only used by daily variables and it means the stop time is on the same day as the start time.
- Day After Start is also only used by daily variables and it means the stop time is a day after the start time.

- Node Tag Field is the signal tag to filter by from the GE Proficy Historian. You can find tag names using the ? the same way you found the signal tag above.
- The second field is the filter operator drop down. This includes the following:
|
SYMBOL |
DESCRIPTION |
| < |
Less than, true if the value returned is less than the filter value |
| > |
Greater than, true if the value returned is greater than the filter value |
| = |
Equal to, true if the value returned is equal to the filter value |
| <= |
Less than or equal to, true if the value returned is less than or equal to the filter value |
| >= |
Greater than or equal to, true if the value returned is greater than or equal to the filter vaue |
| <> |
Not equal, true if the value returned is not equal to the filter value |
- The last field is the filter value. The value returned from the filter tag is compared to this value.