FIELDS:
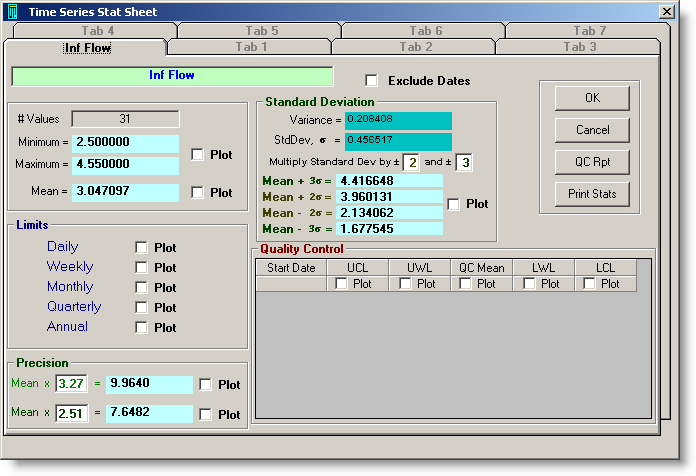
# Values: Displays the number of data points in the date range.
Maximum: Displays the maximum value of the plotted data for the variable. Select Plot to graph the Maximum and Minimum lines on the graph. The minimum and maximum are always graphed together.
Minimum: Displays the minimum value of the plotted data for the variable. Select Plot to graph the Maximum and Minimum lines on the graph. The minimum and maximum are always graphed together.
Mean: Displays the mean (average) value for the values in the date range. Select Plot to display the Mean Line on the graph.
Limits: Daily, Weekly, Monthly, Quarterly and Annual Limit values defined in Variable Setup, Limits tab setup can be plotted on the graph. If a limit value changes during the time period displayed, the limit line will reflect each of the values as they change.
Standard Deviation: Plots the Default 2, 3 standard deviations for the date range. You can plot different multipliers by changing the multiple standard deviation text boxes.
Precision: Plots the Precision values for the current data set. The default multipliers are for Shewhart sample sizes of 2 and 3.
Quality Control: Plots the Quality Control values for the variable. The Lower Control Limit (LCL), Lower Warning Limit (LWL), Upper Control Limit (UCL), and Upper Warning Limit (UWL) are set in the Variable definition (Edit/View Variables, QC Limits tab).
BUTTONS:
 |
Outputs graph as a jpg and emails it to user specified email addresses. |
 |
Outputs graph to the current printer. |
 |
Outputs a QC Analysis Report for the variable. |
 |
Prints a report of all of the statistical information generated for the current graph. |