GRAPHTS returns a time series graph into the cell.
SYNTAX:
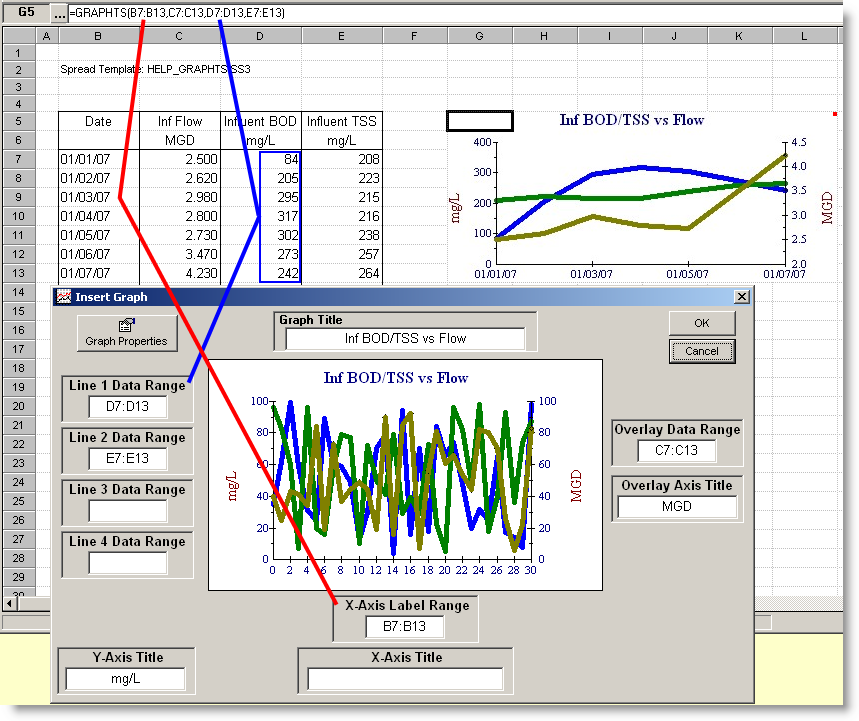
GRAPHTS(X-Axis, Overlay,Line1,optional Line2,optional Line3,optional Line4,optional Line5,optional Line6)
X-Axis: A cell range that sets the X-Axis Labels.
Overlay: A cell range that sets the data for the overlay (overlay line is on a 2nd y-axis and typically shows data with different units than the other lines) line of the graph. Set to -1 if no Overlay line.
Line1: A cell range that sets the data for the 1st line of the graph.
Line2: A cell range that sets the data for the 2nd line of the graph.
Line3: A cell range that sets the data for the 3rd line of the graph.
Line4: A cell range that sets the data for the 4th line of the graph.
Line5: A cell range that sets the data for the 5th line of the graph.
Line6: A cell range that sets the data for the 6th line of the graph.
NOTES:
Use Locate, Graph, Time Series to locate this formula.
EXAMPLES:
GRAPHTS(B7:B13,C7:C13,D7:D13,E7:E13) - Produces graph using B7:B13 as the X-Axis labels, C7:C13 as the overlay data,D7:D13 as the first line data, and E7:E13 as the second line data.
Download Example Template: Help_GRAPHTS.ss3 (Click here for download instructions)