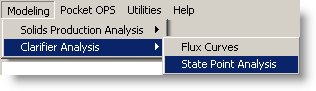
|
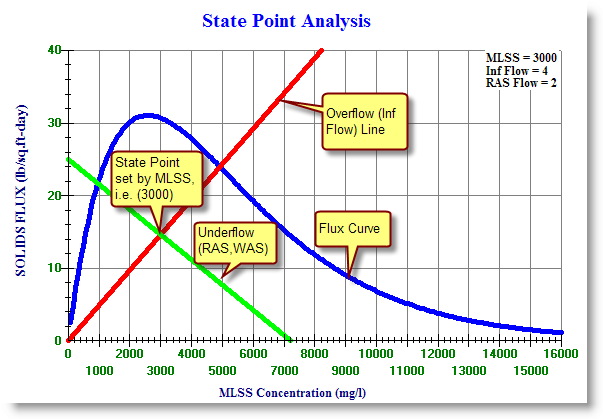
This option provides a graphical analysis of the effects of existing or proposed operating conditions on clarifier performance. A flux curve is generated corresponding to selected solids settling data. Operating lines representing overflow and recycle conditions are placed on the curve to indicate predicted clarifier performance. |
 |
USING:
From the drop down list of available flux curves, pick a date which best estimates the current solids settling characteristics. Use the most recent data provided that there is no evidence of change in settling properties since the last analysis.
If settling properties have changed, and current data is not available, selection of a discrete flux curve that parallels current sludge settling characteristics can be made using the Individual Flux Curve option. For example, if bulking sludge conditions were occurring, a previously created flux curve corresponding to bulking conditions could be selected as an approximation of current conditions until more accurate settling characteristics could be collected and used to create a new flux curve.
After reviewing the flux analysis, Modeling provides the option of reploting the curve with new:
- clarifier configuration
- influent flow rate
- recycle flow rate
- MLSS concentration
- flux curve
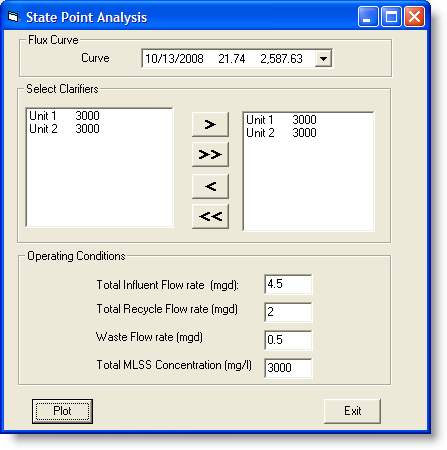
FIELDS:
Total Influent Flow Rate(MGD): Enter the flow for this analysis.
Total Recycle Flow Rate(MGD): Enter the recycle for this analysis.
Waste Flow Rate(MGD): Enter the waste flow for this analysis.
Total MLSS Concentration(mg/L): Enter the MLSS for this analysis.
BUTTONS:
 |
Selects highlighted clarifier. Note the surface area of the clarifier as entered in Modeling - Clarifier Setup appears next to the unit identification. |
 |
Selects all clarifiers.
|
 |
Un-selects highlighted clarifier.
|
 |
Un-selects all clarifiers.
|
 |
Draws the flux curve and the overflow and recycle lines for your visual inspection.
|
 |
Returns to the main menu. |
EXAMPLES:
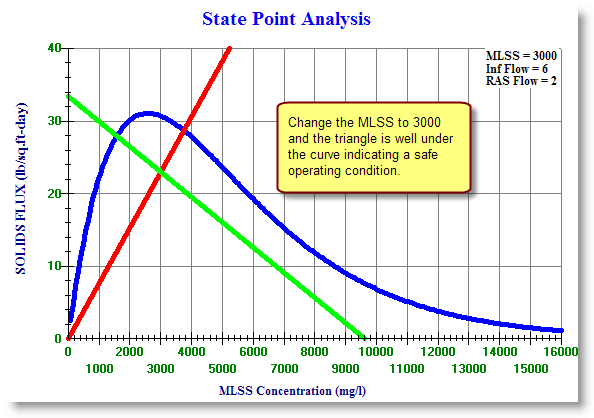
If you increase the MLSS to 3800, and your flow is 6 you end up in an overloaded condition:
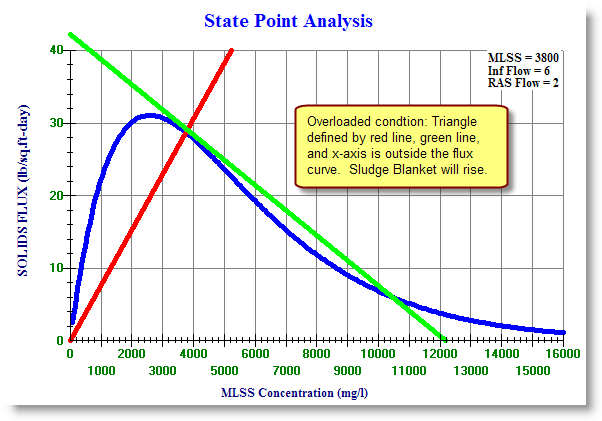
Now lower the MLSS to 3000 to bring the system into a safe condition.