|
Multiple Linear Regression produces a multiple variable linear correlation (the affect of many variables on one variable) plot. For example, a Multiple Linear Regression graph can show how your Effluent BOD is affected by Influent BOD, Clarifier Blanket Height, and MLSS. Whereas Correlation graphs draw a straight line thru the data points, MLR draws a plane thru the n dimensional data points (using the least squares method).
|
 |
USING:
In a cause and effect relationship, the cause is the independent variable that affects the dependent variable. For example, when it rains the plant flow increases. Rainfall is the independent variable and plant flow is the dependent variable.
To create a Multiple Linear Regression Graph:
- Fill in the Start and End dates. Keep in mind that the more data you use, the better the calculations will reflect what actually happens.
- Select the dependent and independent variables, and click View. The graph will then be displayed on the screen which can then be customized (change fonts, colors, line types, etc...). At least 2 independent variables must be selected to create this 3-dimensional graph. A third independent variable may be selected but it will only be used with a constant value. You will be prompted for this value when you view the graph. If more than three independent variables are selected (up to 7 may be used), the equation and the coefficient of correlation will be calculated but no graph will be shown.
The coefficient of correlation is calculated as a measurement of the goodness of fit. The higher the Coefficient, the better the fit (1.0 being a perfect fit).
FIELDS:
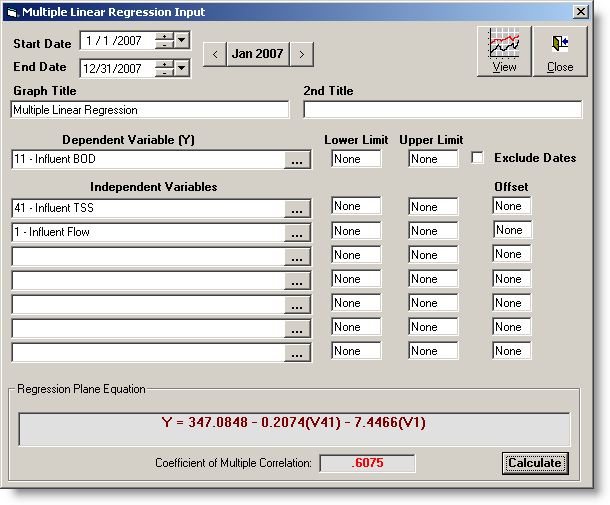
Start Date: Beginning date of the date range to analyze.
End Date: Ending date of the date range to analyze.
Graph Heading: The main heading for the graph, appears at the top of the graph.
2nd Heading: The subheading for the graph. Appears just below the Graph Heading.
Dependent Variable (Y): Use the variable picker to choose the dependent variable (shown on the Y-Axis). The causes are the independent variables that affect the dependent variable.
Independent Variables: Use the variable picker to choose the independent variables (the variables that affect the Dependent variable)
Lower Limit: Used to filter the data. During analysis, any values less than the lower limit are ignored. If the field is left blank, None displays in the field indicating there is no Lower Limit.
Upper Limit: Used to filter the data. During analysis, any values greater than the upper limit are ignored. If the field is left blank, None displays in the field indicating there is no Upper Limit.
Offset: Indicates the forward difference in days to be used when comparing a value for the independent variable with that of the dependent variable. For example, if the offset is 3 (three) the dependent value of January 25, 1999 would be compared with the independent value of January 22, 1999. Using the Offset, you can do analysis like how yesterdays Rainfall affects today's flow. Leave blank for no offset.
Regression Plane Equation: The equation of the least squares plane. You can use this equation to solve for the Dependent variable (Y). For example, with the equation Y = 346.5572 - 0.2027(V41) - 7.1912(V1) to predict Inf BOD on a day you simply replace V1 and V41 with there values:
V1 - Flow is 2.5
V41 - Inf TSS is 231
therefore Inf BOD is predicted to be: 281.76 (346.5572 - 0.2027(231) - 7.1912(2.5)
Note: You may want to create a calculated variable called Predicted Inf BOD and set the equation equal to your Regression Plane Equation.
Coefficient of Multiple Correlation: Calculated as a measurement of the goodness of fit. The higher the Coefficient, the better the fit (1.0 being a perfect fit).
BUTTONS:
 |
Used to set a date range |
 |
Displays the graph. Up to 3 independent variables can be plotted (the 3rd variable you will be prompted to fix, i.e. set to a constant value). If more than 3 independent variables are chosen, the graph will be not be displayed but the Regression Plane Equation will be calculated to use in predictions. |
 |
Closes the graph form. |
 |
Calculates the Regression Plane Equation based on the current settings (without displaying the graph). Useful when evaluating more than 3 independent variables. |