Ado Calc Engine Profiling Test and Results
The purpose of this document is to show the difference in performance and system load between the OPSSQL AdoCalc service running in stand-alone and in load-balanced mode.
Background:
The OPSSQL AdoCalc engine is responsible for performing calculations on calculated variables. It's implemented as a Windows NT service.
In "standard", or non load-balanced mode, it runs as a single process and processes calculation requests in the order they come in, unless two or more "overlapping" requests can be combined.
An administrator can choose to deploy it in load-balanced mode, which offers more flexibility and potential big performance gains when multiple long-running calculation requests are pending.
To see how to setup AdoCalc in load-balanced mode, see the attached article.
Test Setup:
The test was run inside a VMware 6.0.x virtual machine installed on an IBM T60 Thinkpad wit 3GB of RAM, an Intel T7400 CPU and a fast 7200 RPM HDD. Both the host and guest OS's are Windows XP SP2.
The database back-end used in the test was a Microsoft SQL Server 2005 SP2 instance. The VM was given access to both physical CPU cores as well as 1GB of RAM.
In order to simulate a realistic scenario, some pre-conditions need to be satisifed:
- More than one OPS facility (each OPS facility is a separate database in the SQL Server)
- Each facility must have data that needs to be calculated
- A SQL script that will generate the calculation requests
- Correct configuraton of the AdoCalc engine
- The OPS WasteWater tutorial database was taken and was duplicated multiple times to create 3 identical facilities:
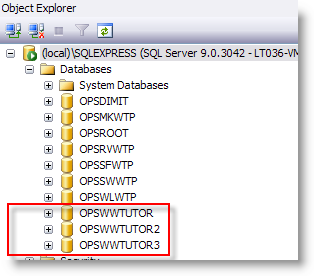
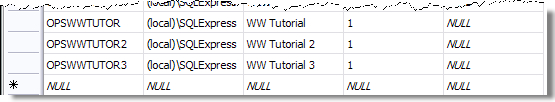
This was done by copying and attaching the same OPSWWTUTOR.mdf file through SQL Studio Manager. Since we don't use OPS Server Setup, we need to change the owner of the attached DB's to OPSDBA manually and also add them to facility table in OPSROOT:

The database used in this test is attached to the article.
- We create a calculated variable that will perform a calculation for the available data and produce multiple results for a specified time frame:
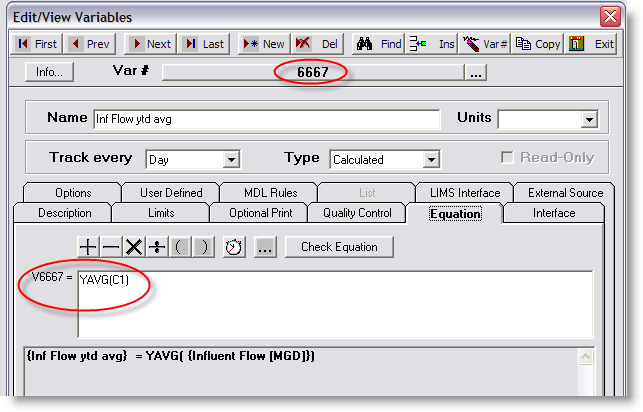
The var number is set to 6667 for easy referral later and it's equaton is set to YAVG(C1), i.e. it calculates the year-to-date average for the specified variable (in this case, var #1, Inf. Flow) and stores the value for each day. Inf. Flow was chosen as the variable to calculate data for due to the large amount of data available in the OPSWWTUTOR database.
- The sql script that generates the calculation requests (attached in the article) deletes all data from the facilities for every variable 6667, clears the calculation queue of any pending requests and submits three requests, non-overlapping, one for each of the facilites, to calculate data for variable 6667 for a period of 3 years and 3 months. The calc queue database insert statements look like this:
insert into calcqueue ([status], audituser,facility,vlist,datestart,dateend) values (1, 'SUPER', 'OPSWWTUTOR3', ',' + CAST(@tutCalcVar3 as varchar) + ',', '2003-12-29', '2007-03-31')
the values are:
'1' - the status. When submitting, should be 1 or 2. 1 means "do not want confirmation when it's done" 2 - I DO want coonfirmation. For the purpose of this test, 1 suffices.
'SUPER' - the "audit user" - who submitted the request. Super is the super user (can be something else, not important)
Next is the VarID, NOT the varnumber, of the variable we're calculating for - this is the ID of var number 6667 described above.
'2003....' - the start date for the calculation
'2007....' - the end date.
Three of these rquests are submitted, one for each of the three test facilities. This way, the calc engine cannot optimize and combine the requests into one big request.
- Engine configuration:
In both test runs, the adocalc.ini file has the LOGSTATS=1 option set, so the calc engine displays the information we require.
In single-engine mode, the ntadocalc.ini file looks like this:
[Settings]
ServiceName=OPSSQL_AdoCalc
ProcCount=1
[Process0]
CommandLine=Adocalc.svc
PauseStart=1000
PauseEnd=1000
UserInterface=No
'ProcCount=1' means the service manager will spawn just one process - an instance of the AdoCalc.svc program.
In load-balanced mode, the ntadocalc.ini file becomes:
[Settings]
ServiceName=OPSSQL_AdoCalc
ProcCount=4
[Process0]
CommandLine=Adocalc.svc 0
PauseStart=1000
PauseEnd=1000
UserInterface=No
[Process1]
CommandLine=Adocalc.svc 1
PauseStart=1000
PauseEnd=1000
UserInterface=No
[Process2]
CommandLine=Adocalc.svc 2
PauseStart=1000
PauseEnd=1000
UserInterface=No
[Process3]
CommandLine=Adocalc.svc 3
PauseStart=1000
PauseEnd=1000
UserInterface=No
A total of 4 AdoCalc.svc processes will be spawned. The one with parameter '0' becomes the dispatcher - it does not perform calculations, rather request dispatching and housekeeping. It monitors the calculation queue and dispatches any available requests to an available worker node. The workers are all AdoCalc.svc process that have a parameter greater than 0 - in this case there are three workers with Id's 1, 2, 3.
Test results
3 requests, calc engine running in non-load balanced mode
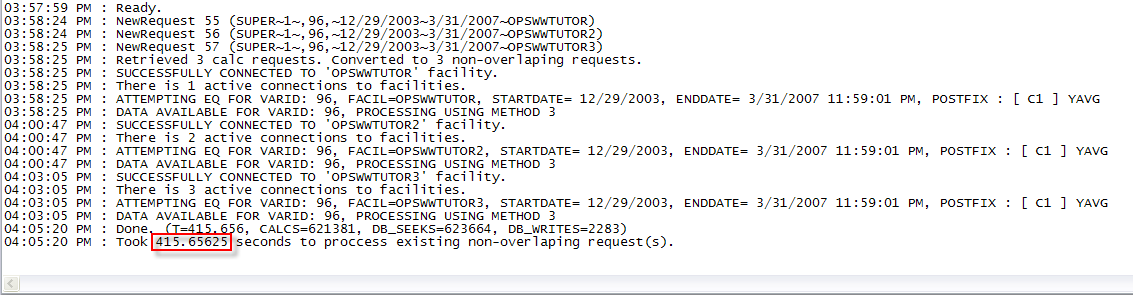
Running in non load-balanced mode, the engine takes almost 416 seconds to process those requests. It does them, as explained earlier, one at a time.
This is a snapshot of the system load, as reported by the MS performance monitor:
There is only one AdoCalc.svc process active - marked by the pink line. The system is not heavily taxed CPU-wise - the total CPU (in yellow) never goes above the 60-ish percent. The big blue spike in the beginning is the database Transactions/sec - this jumps when we load our database. The blackish like in the SQL Server CPU and the pink - AdoCalc. They both hover in the 30-40% range.
3 requests, load-balanced mode
These are excerpts taken from the 3 worker node log files:
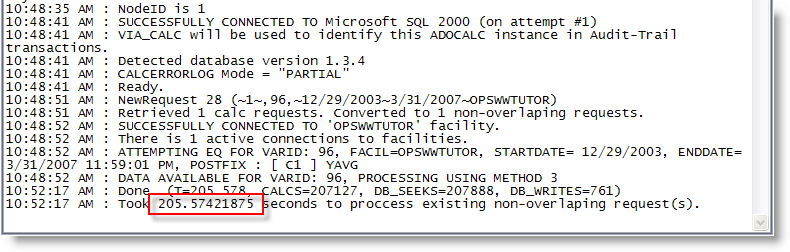
Node 1:
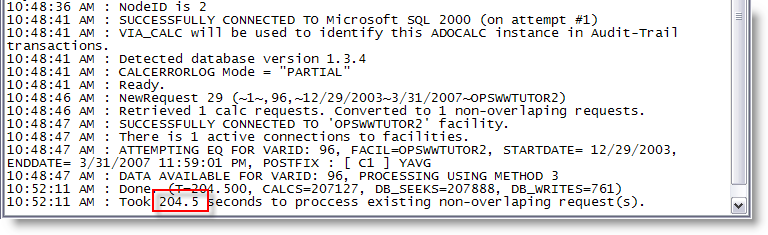
Node 2:
Node 3:
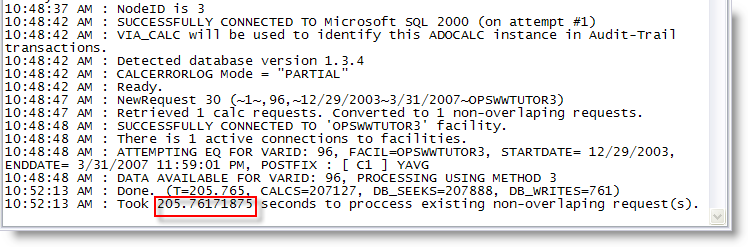
The time taken for all three requests is now roughly cut in half.
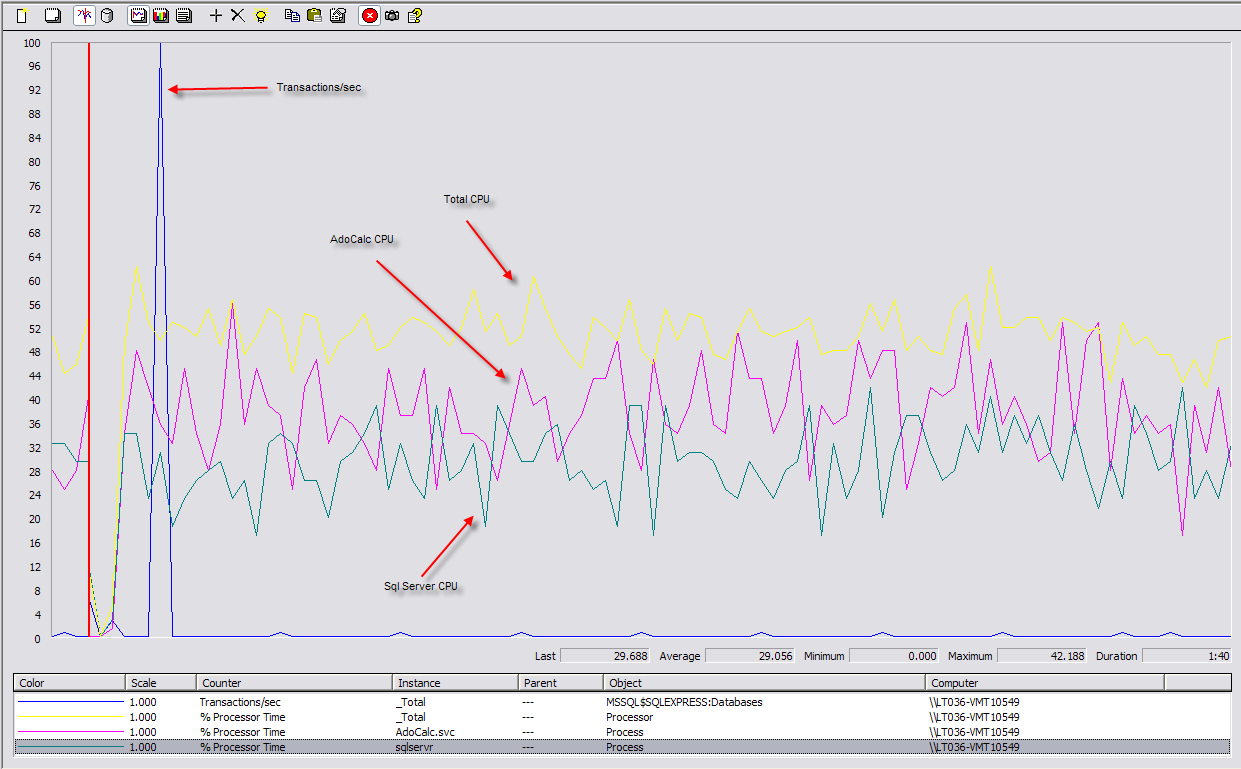
The system load:
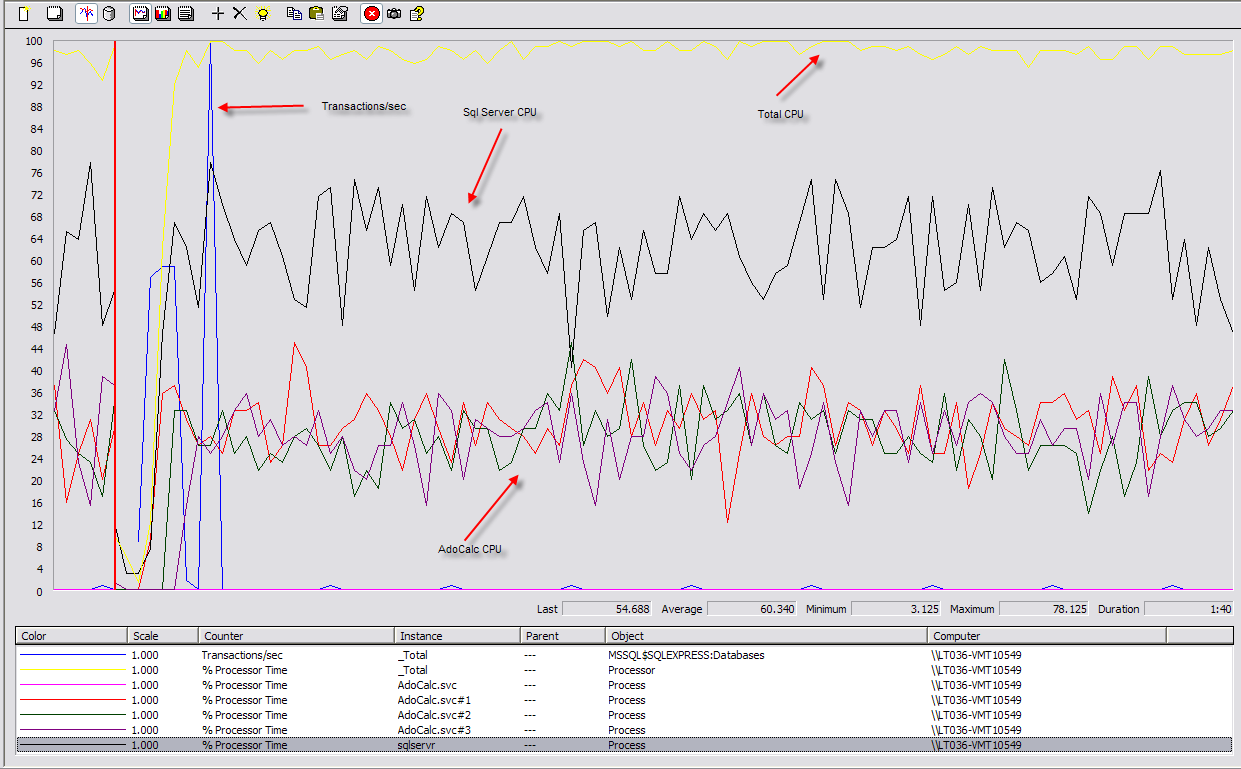
The total system load is the yellow line again and this time the CPU is pegged at pretty much a 100%. The three red-green-blue lines are the AdoCalc processes and the black line is the SQL Server.
Conclusion:
Enablding Ado-Calc load-balancing can improve the performance of multiple pending non-overlapping requests dramatically, at the expense of system resources.