|
|
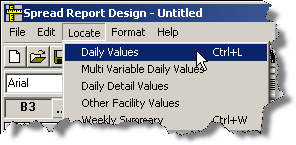
Used to locate daily variable values into a spread report. For example, you can locate the Influent Flow for each day of the month. |
 |
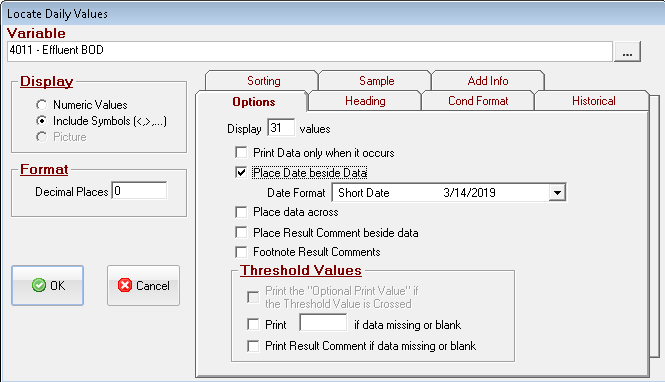
Variable: Select the variable to locate using the variable picker.
Display: For variables set up to use MDL Rules, indicate whether you want to see the numeric values or if you would rather see the data including <,>, or ND symbols. For picture type variables, Picture will automatically be chosen (VPIC Spread Function will be located)
Format: Specify the number of decimal places to show behind the decimal point. This value will default to the number of decimal places defined in the description of the variable selected. See Also: Formatting with 'Not Fixed'
Options Tab
Display ___ values: Sets the number of values to be placed.
Print Data only when it occurs: Skips days with no data. See Print Data only when it occurs example for more information.
Place Date beside data: Places the corresponding date in the column next to the located data.
Date Format : Sets the format (ie 12/31/97, Dec 31, etc...) for the date column. See Date Formats.
Place Data Across: Locates data horizontally in a row rather than in a column.
Print Optional Print Value if the Threshold Value is crossed: If checked, the variable's optional print value will be output instead of the actual value when the threshold is crossed.
Note: If optional print values are used, data is placed as text. Therefore data placed in this manner cannot be used in other formulas. This data may be summarized using Monthly, Weekly or Report Summary features.
Print _____ if data is missing or blank: On days with no data, the entered text will be output. Example, if outputting a BOD and there was no sample taken that day, you can output "NO SAMPLE" on those days.
Print Result Comment if data missing or blank: On days with no data, the result comment will be output.
Cond Format Tab
Conditionally Format Cells: Check to format cells that are located.
When Value of Cell is:
Comparison: Select what type of comparison to make. NOTE: when comparing a text cell the comparsion is NOT case-sensitive (i.e. Hello is equal to HELLO, heLLo...). When comparing numeric values, we compare the displayed value to the entered limit (i.e. a cell has a formula of =3.14159 but is displayed to 2 decimals so 3.14 is displayed, 3.14 is compared to the limit NOT 3.14159). Choose from the following list.
- is Equal to
- is Not Equal to
- is Greater than
- is Greater than or Equal to
- is Less than
- is Less than or Equal to
- is Between
- is Between (Exclusive)
- is Not Between
- is Not Between (Exclusive)
- Contains - If the character(s) entered in the limit are anywhere in the cell.
- Does not contain - If the character(s) entered in the limit are NOT anywhere in the cell.
- Is Detected - If the cell starts with "ND" or starts with "<".
- Is Not Detected - If the cell does NOT start with "ND" or starts with "<".
- Is Empty - If the cell is blank or empty.
Limit: Indicates limit of condition for the variable to be used. Can be a constant (i.e. 10, Hello), refer to a the value of a cell using the CELL(A1) syntax where A1 is the cell to compare to, or the value can be looked up from a variable field such as Daily Limit, Entry Limit etc...
Variable: If a lookup is chosen you must select the variable to get the value from.
Offset: When looking up the limit, you can specify which dates to use to lookup for. For Example, if you are showing three months of daily values (each month is column) and your limit changes every month, for column 2 (2nd month of the report) you would set the offset to 2.
Set Cell Format To:
Set Foreground Color to: Displays selected color of cell foreground if condition is met
Set Background Color to: Displays selected color of cell background if condition is met
Set Bold: Bolds data in cell if condition is met
Set Italic: Italicizes data in cell if condition is met
Hide Row: Hides the entire row if condition is met.
Heading Tab
Select What to display in the heading: Check all fields to be displayed in the column heading.
Historical Tab
Get data outside of report data range: If checked, the variable located will get data from outside of the report dates based on interval set, and the number of intervals specified. Locates the V spread function.
Sorting Tab
Sort Values: Arranges the data for the variable in value order instead of date order. Data can be sorted in either Descending Order (highest to lowest) or Ascending Order (lowest to highest). See the DSORT function for more information.
Sample Tab
Place the following fields from the associated Sample beside the data: If checked will place all the checked fields beside the data value from the Lab Cal Sample Information. (Requires Lab Cal Add-on)
Add Info Tab
Places all checked Data Additional Info fields beside the data value.
|