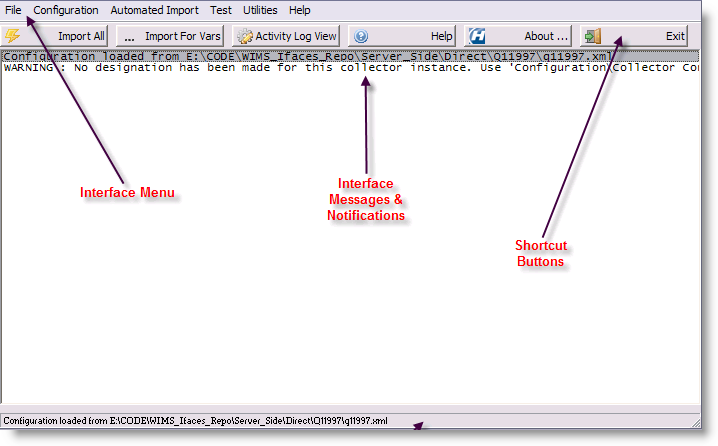
This is the main interface interactive screen.
When running in interactive mode, you can set the various interface configuration settings, monitor & control the interface service, as well as interactively collect data.

The main parts of the of the screen of interest are:
- Main Menu
- The Shortcut Buttons:
- The Interface Messages & Notification area - the white background area displays scrolling text regarding the interface's activity. All manner of data is logged here, including data collection status, errors, warnings and other general information regarding the interface's current activity.
Depending on the Verbosity level set, you may or may not see all information.
If there is a directory called "Log" in the interface directory, the interface will also log to a text file of the form:
<mm_dd_yyyy__hh_mm_ss_interactive.log>
E.g., if the current date is 2/26/2009 and the current time is 3:02:13 PM, the file will be called:
02_26_2009__15_02_13_interactive.log.
- The status bar, at the bottom of the screen, displays miscellaneous information regarding the interface.