|
Scatter Graph allows you to combine multiple variables into one chart.
|
 |
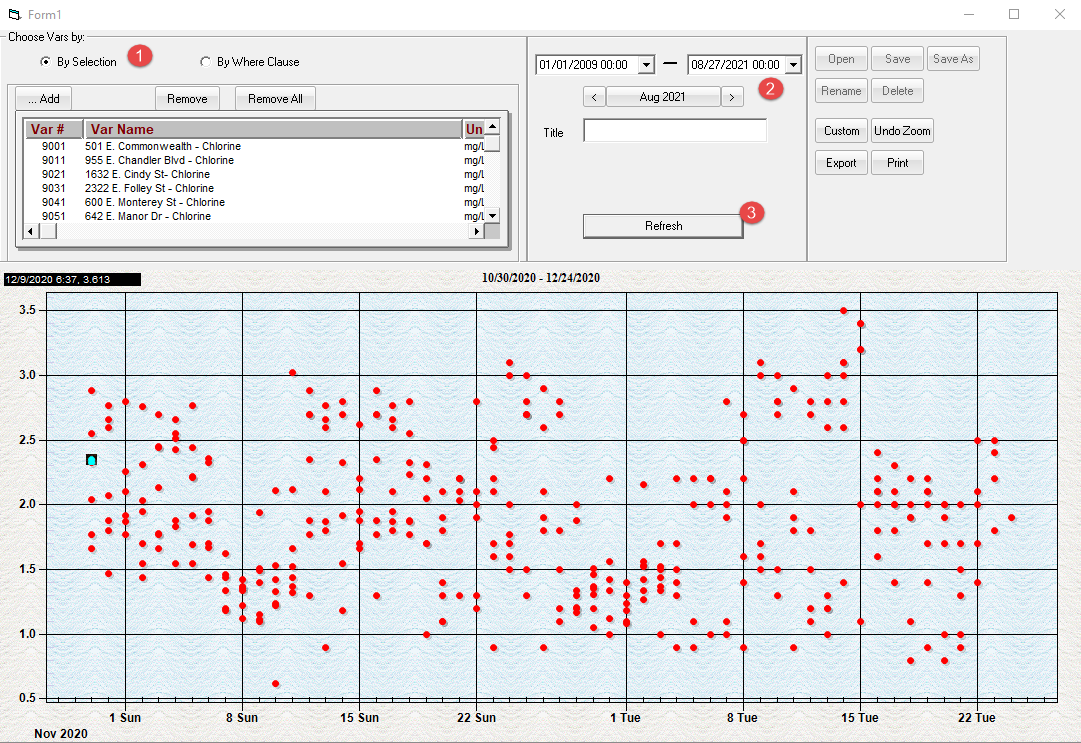
1. Choose Variables By: Sets how to select the variables to summarize.
By Selection allows you to use the variable browser to pick the variables to summarize. Click to display the variable browser to add variables to the list.
By Where Clause:
Allows you to enter the Where portion of an SQL Select statement using the Vardesc table (FROM VARDESC) to select the variables. Examples: VarNum < 10, STORETCODE = '00310' OR STORETCODE = '80082', NAME LIKE '%TOTAL COLIFORM'
2. Choose the date range
3. Click Refresh and the Scatter Graph will be displayed.
Tip: Highlighting data for a variable
If you select a variable in the displayed variable list, the data points for that variable with be highlighted in blue. You can also select a point in the chart, and that variable will be selected in the variable list and all it's points will turn blue.
NOTE: Does not work when using a Where Clause or when more than 200 variables are selected to chart.