|
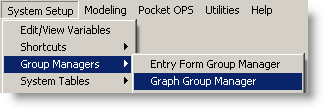
Hach WIMS Graph Group Manager helps you organize your graphs (i.e. saved time series, correlation graphs...) into groups. Graph groups also allow assigning read/write access to graphs in those groups to individual users. |
 |
USING:
With Graph Group Manager you can:
- Create Groups of graphs that only certain users are allowed to use.
- Create a Group for your Weekly graphs to make them easier to find..
- Managers can create groups that will contain graphs for their eyes only.
BUTTONS:
 |
Used to grant permissions to the currently selected group. See Graph Group Access Permissions. |
 |
Creates a new group. |
 |
Deletes the currently selected group. Graphs in the group will NOT be deleted, they are moved into the default group where they can be reassigned to a different group. |
 |
Used to move graphs to a different group. Cuts the currently selected graphs to the buffer where they can subsequently be pasted into a different group. |
 |
Pastes the graphs in the buffer into the current group. |
 |
Closes the form. |
EXAMPLES:
Example 1. CREATING GRAPH GROUPS
1. Click  . The following window will be displayed:
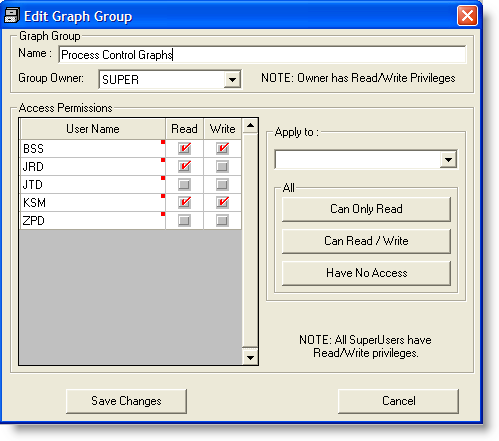
2. Enter a name for your Group. In this example, Process Control Graphs is our group name.
3. Set each users permissions by checking the Read (means they can view the graph) and Write (means they can edit the graph definition) checkboxes. Specifying access permissions is a simple process. Users who have access to the current facility and who are not super users are listed in the “Access Permissions” column on the left. Click on the checkboxes to active the read or write permission.
NOTE: SUPER users always have Read and Write privileges to all forms.
You can use the “Apply to” feature to set access permissions for current group for all users of a certain type (See User Setup for more information on User Types). For example, if all Mangers should have Use/Design Access to all reports in the Group then you would use the “Apply To” feature.
- Select a user group from the drop down list.
- Click the appropriate permission level buttons. (Notice how the “Access Permissions” on the left changes each time you click on a different button).
4. Click OK to create the Group. Users with Read permission to the group will now see Process Control Graphs when loading a graph from Time Series Graph, Correlation Graphs.
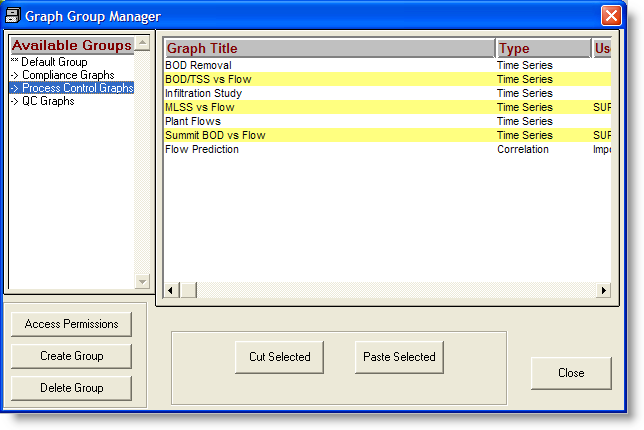
Example 2. ORGANIZING GRAPHS:
To move a graph to a different group.
1. Click on the Group that currently contains the graph(s) you want to move. For example, if you want to move the Operator Log form from the Monthly Data Entry group to the Operator Forms group, click on the Monthly Data Entry Group and all it's forms will be displayed.
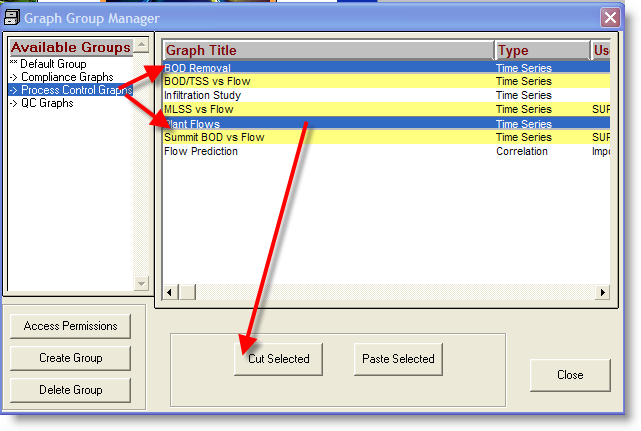
NOTE: You can click on multiple graphs to move multiple graphs at one time.
2. Now click on the graph Group that you want your form to reside in. Continuing our example, click on “Compliance Graphs"
3. Now click the Paste Selected button. This will move the BOD Removal and Plant Flows graphs to the “Compliance Graphs” group. You will be prompted for a confirmation, click Yes.
Example 3. DELETING GROUPS:
This function will NOT delete the graphs in the group. The graphs will be moved back to the Default Group.
1. Click on the Graph Group Name to be deleted.
2. Click 
3. Click Yes to confirm.